Sing Buri satellite images 2017–2025: how it changed
9 yearly Sentinel-2 images of Sing Buri, from 27 Jan 2017 to 15 Jan 2025. Green cover in true colour moved from 49% to 58% (+9 percentage points) across a 8 × 8 km box.
Before and after
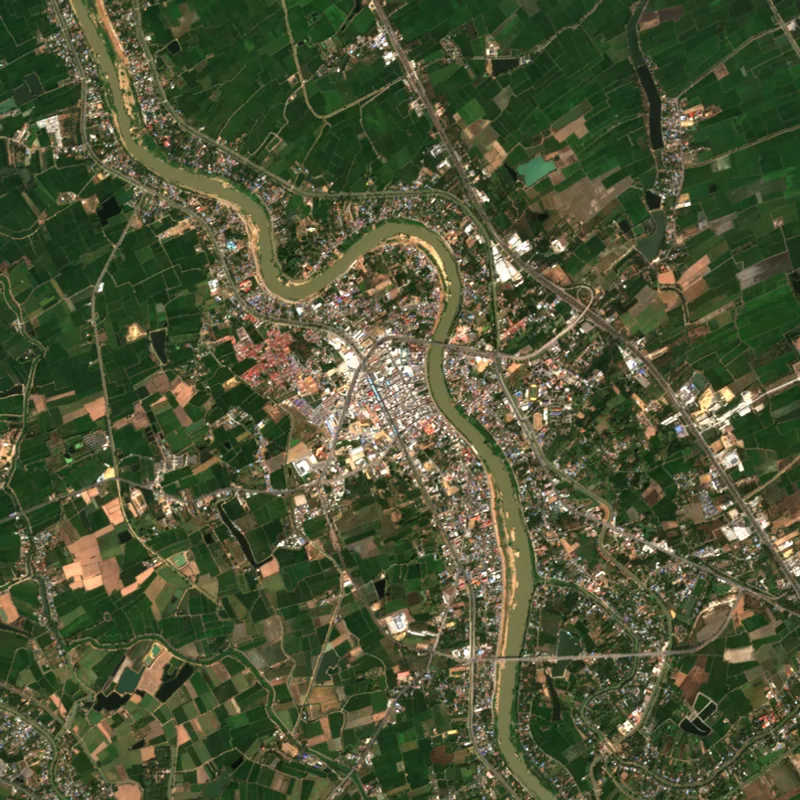
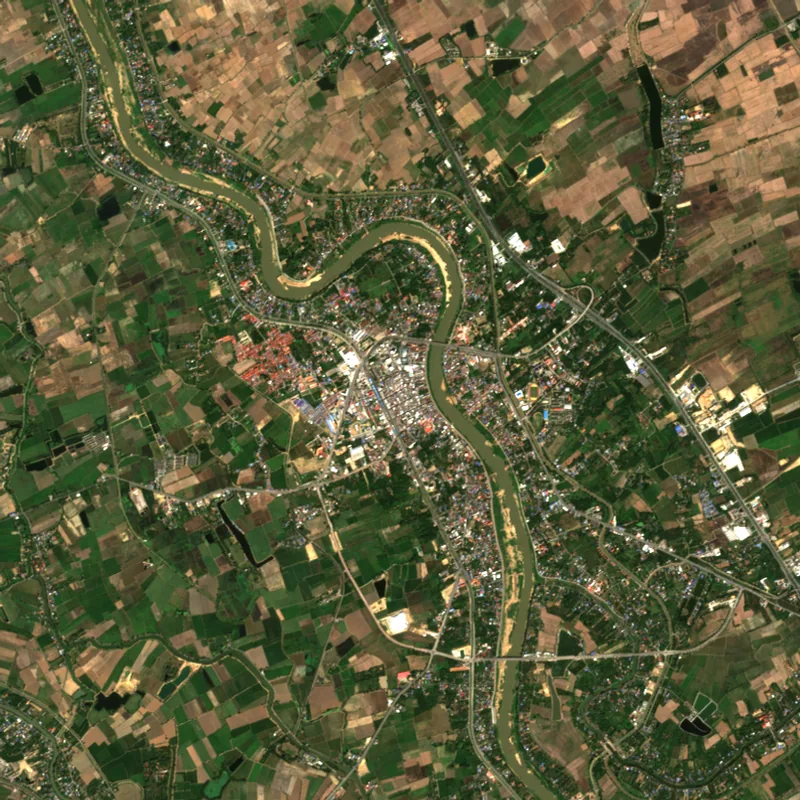 20172025
Drag the divider or use the arrow keys.
Year by year
27 Jan 2017 · cloud 0% · green 49% 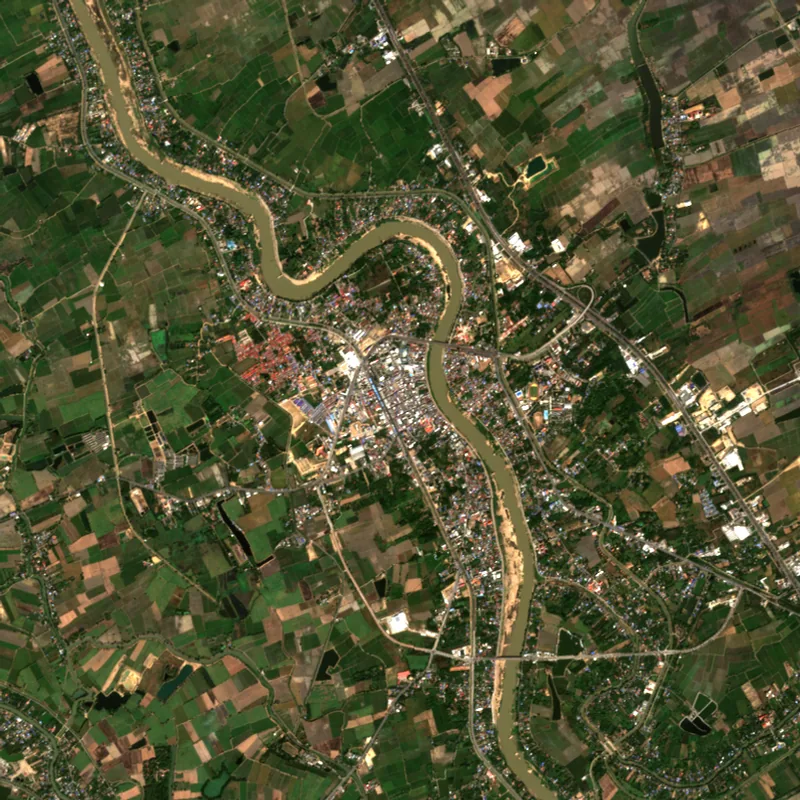
23 Dec 2017 · cloud 0% · green 45% 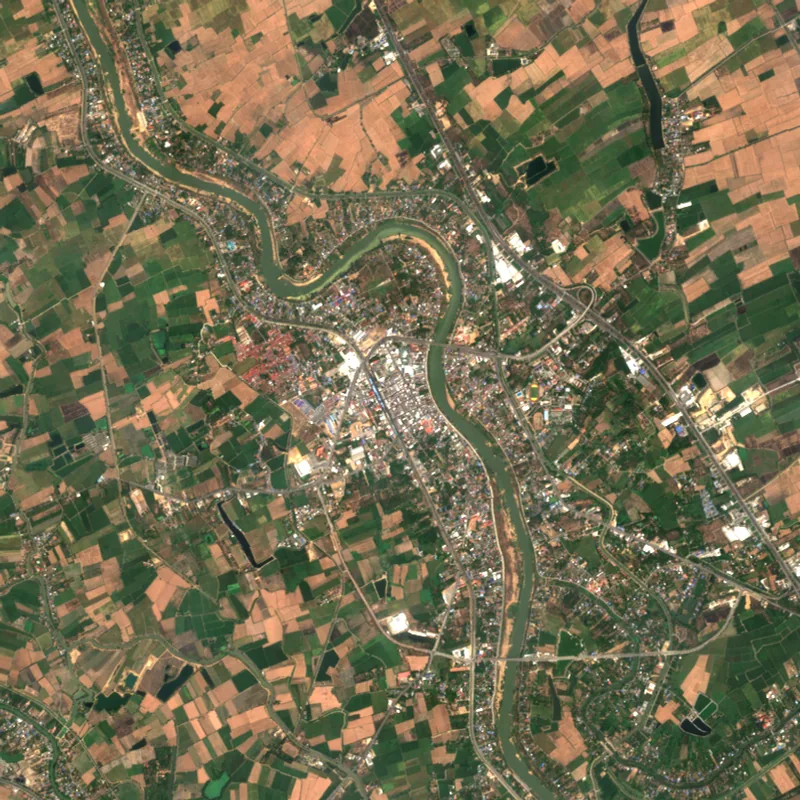
13 Mar 2019 · cloud 0% · green 40% 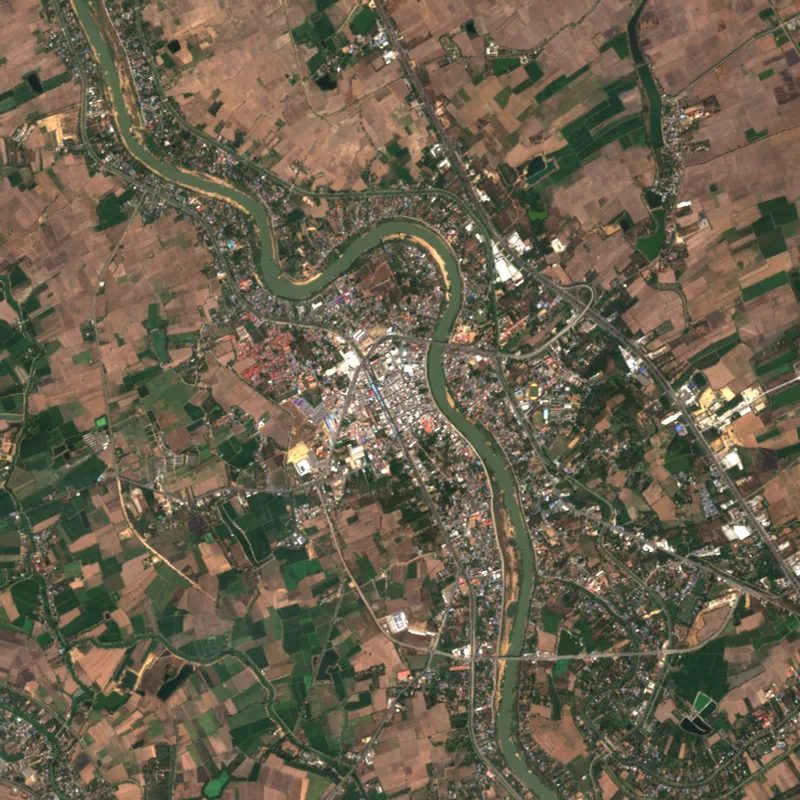
27 Jan 2020 · cloud 0% · green 31% 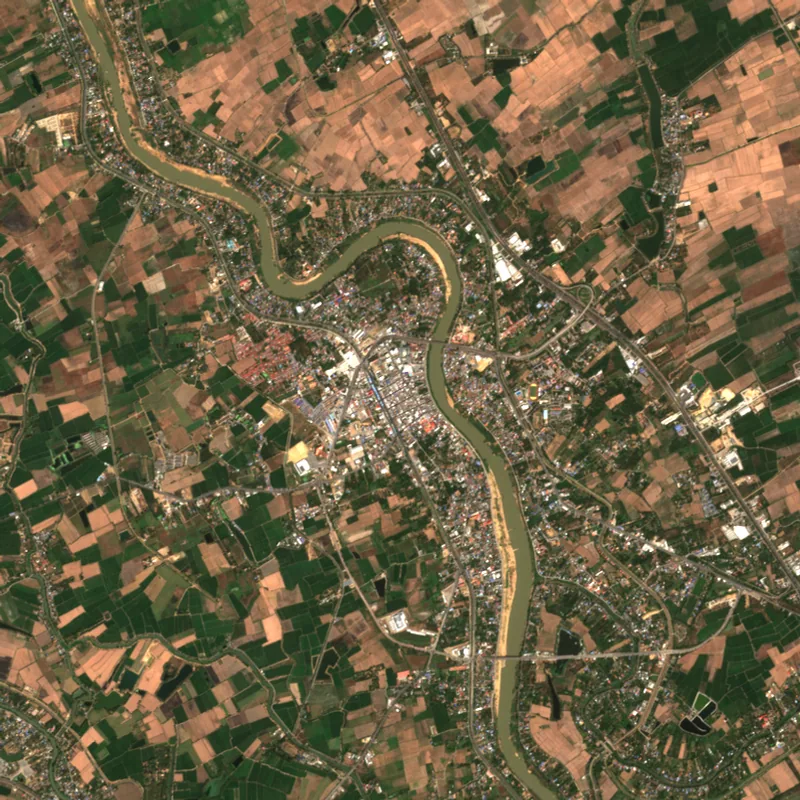
5 Feb 2021 · cloud 0% · green 31% 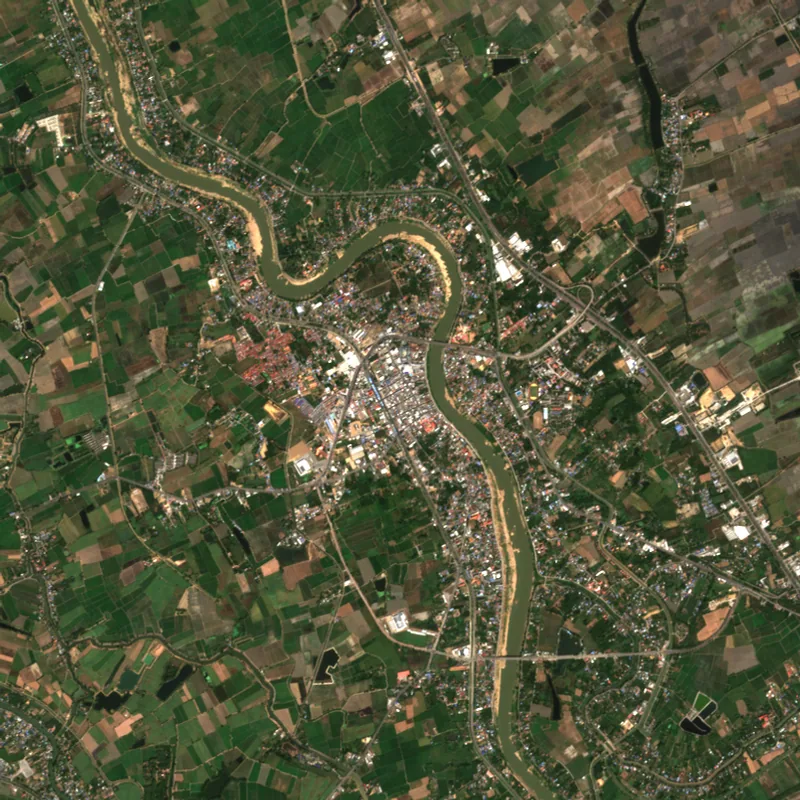
22 Dec 2021 · cloud 0% · green 50% 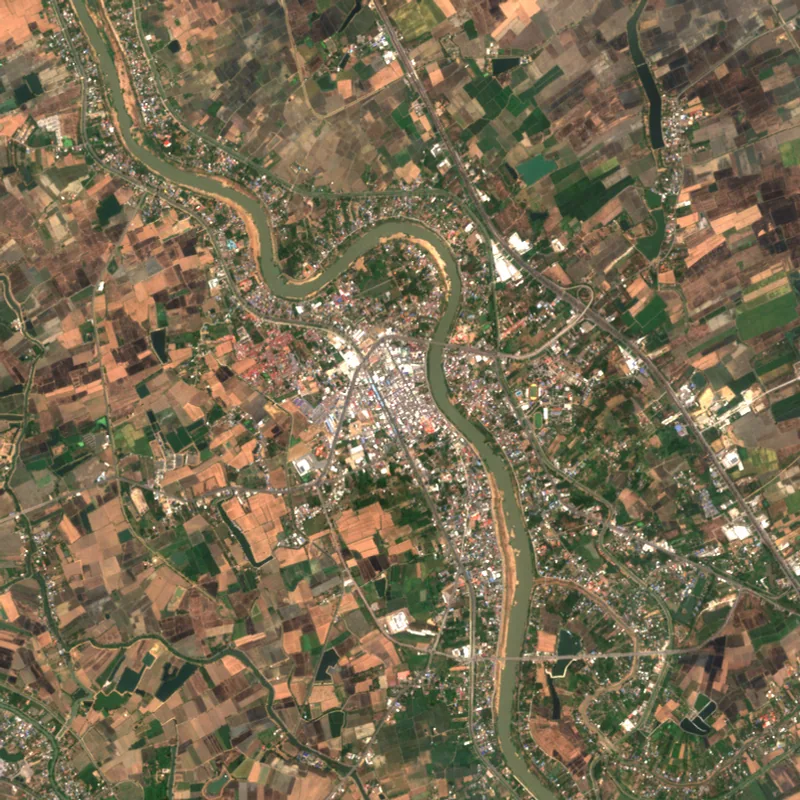
21 Apr 2023 · cloud 0% · green 24% 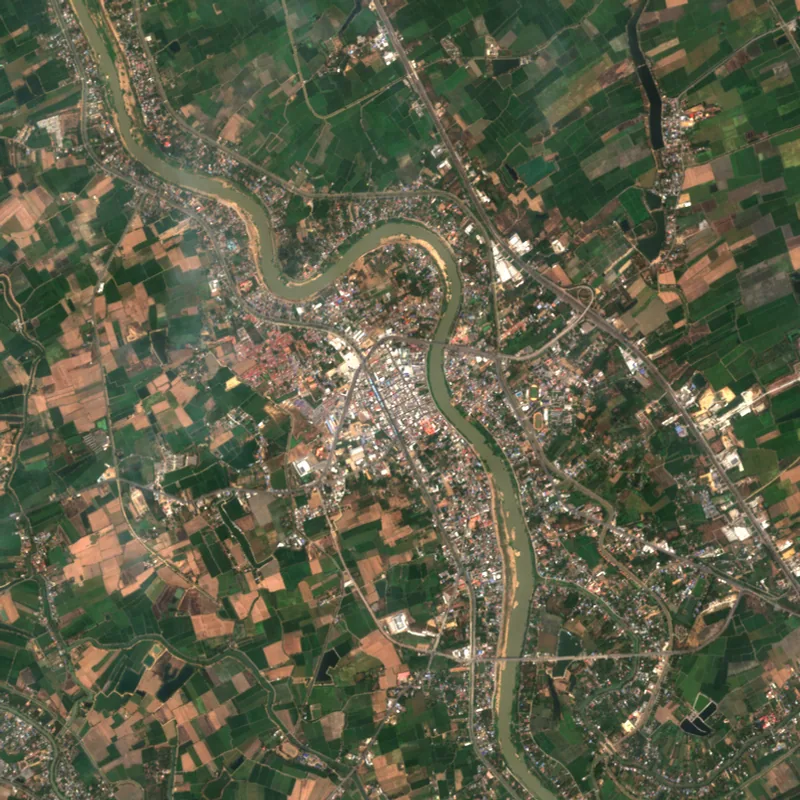
15 Feb 2024 · cloud 0% · green 49% 15 Jan 2025 · cloud 0% · green 58%
Yearly facts
| Year | Acquired | Cloud cover | Green cover | Valid pixels |
|---|---|---|---|---|
| 2017 | 27 Jan 2017 | 0% | 49% | 100% |
| 2018 | 23 Dec 2017 | 0% | 45% | 100% |
| 2019 | 13 Mar 2019 | 0% | 40% | 100% |
| 2020 | 27 Jan 2020 | 0% | 31% | 100% |
| 2021 | 5 Feb 2021 | 0% | 31% | 100% |
| 2022 | 22 Dec 2021 | 0% | 50% | 100% |
| 2023 | 21 Apr 2023 | 0% | 24% | 100% |
| 2024 | 15 Feb 2024 | 0% | 49% | 100% |
| 2025 | 15 Jan 2025 | 0% | 58% | 100% |
Method and limits
- Sentinel-2 true colour at 10 m per pixel, so single houses are not visible.
- One clear dry-season acquisition per year; seasons and sun angle still differ slightly between years.
- Green cover is an RGB approximation of green-dominant pixels, not NDVI.
- Clouds, haze and shadows can remain in a scene even after selection.
Contains modified Copernicus Sentinel data, processed by MapScale.
Look at any other area
The live map shows satellite history for any box you draw, not just the places listed here.
Open satellite history on the live map